CAD Studio - CAD/CAM/GIS/BIM/PLM solutions


")
 3DPlot utility creates algorithmic 3D objects
CADStudio 3DPlot is an AutoLISP utility for AutoCAD - it generates parametric 3D surfaces (polyline meshes) from mathematic expressions (functions, equations). You can use 3DPlot for educational purposes (math visualization) but also in the design area - e.g. for creation of attractive architectural features, interior design, product design, sconces, for art design, etc. See also 2DPlot for 2D curves.
The core application contains functionality required to generate 3D objects from results of math expressions of the type f(X,Y) -- or even in a more general format [X,Y,Z] = f(U,V). You need to specify a user defined function for "f", plus a definition interval of U and V values (starting value, end value, step size). Lower step size makes smoother but more complex models which take longer to generate.
After loading 3DPlot you can generate the 3D graphical results simply by calling the LISP function:
(3DPlot functionName startU endU stepU startV endV stepV)e.g. (see case 1 - Whitney’s umbrella; 20 steps):
(3DPlot fXY -1.0 1.0 (/ (- 1.0 -1.0) 20) -1.0 1.0 (/ (- 1.0 -1.0) 20))The 3DPlot utility also contains 9 predefined functions (equations of 3D surfaces) to demo its features. Here is the list of them, including animated previews of their results (click to animate):
1) Whitney’s umbrellaInteresting 3D surface defined just by a simple equation. The math definition used for this function: X=U*V, Y=U, Z=V^2 -- in AutoLISP notation: (defun fXY(u v)(list (* u v) u (* v v))) |
 Whitney’s umbrella (click to animate) |
2) Apple surfaceA fancy apple-like shape. The math definition used for this function: (defun fXYApple (u v) (list (* (cos u) (+ 4.0 (* 3.8 (cos v)))) (* (sin u) (+ 4.0 (* 3.8 (cos v)))) (+ (* (+ (cos v) (sin v) -1.0) (+ 1.0 (sin v)) (log (- 1.0 (* pi (/ v 10.0))))) (* 7.5 (sin v))) )) |
 Apple (click to animate) |
3) Kranz surfaceA wild 3D surface with simple definition. The math definition used for this Kranz surface: (defun fXYKranz (u v) (list (/(cos (+ u 4)) 3) (+(*(cos u)(sin v)(cos v)(sin u)(cos v))(* 0.5 (cos u))) (*(cos v)(sin u)(cos u)(sin v)) )) |
 Kranz surface (click to animate) |
4) Enneper surfaceAnother pleasant 3D surface with simple definition. The math definition used for this Enneper surface: (defun fXYEnneper (u v) (list (+ u (/ (* u u u) -3.0) (* u v v)) (+ v (/ (* v v v) -3.0) (* v u u)) (- (* u u) (* v v)) )) This plot is invoked by: (3DPlot fXYEnneper -2.0 2.0 0.1 -2.0 2.0 0.1) Or a non-intersecting version of Enneper: (3DPlot fXYEnneper -1.6 1.6 0.1 -1.6 1.6 0.1) |
 Enneper surface (click to animate) |
5) RoseQuite complicated rose surface, generates 13.800 nodes (takes a while to generate!). Doesn't look much "mathematically" but it is also just a math expression... |
 Rose (click to animate) |
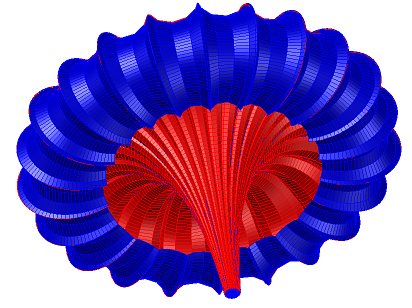
6) Heart surfaceA 3D heart shape you might need (not just for Valentine). The math definition used for this function: (defun fXYHeart (u v) (list (*(cos u) 4 (sqrt(- 1 (* v v)))(expt(sin(abs u))(abs u))) (*(sin u) 4 (sqrt(- 1 (* v v)))(expt(sin(abs u))(abs u))) (* v 1.3) )) |
 Heart (click to animate) |
7) Boys surfaceA very special surface - a non-orientable surface (after Bryant-Kusner). One-sides surface of a similar type as Klein's bottle (a 3D version of Möebius strip). Gives a Willmore immersion. More about Boy's surfaces. |
 Boy surface (click to animate) |
8) Henneberg surfaceAn attractive surface based on hyperbolic functions. Can be used in architecture and interior design. |
 Henneberg surface (click to animate) |
etc.Added more samples like Meader owl, Parametric sphere, Breather surface, Bohemian dome, Trefoil knot curve, Hyperbolic helicoid or Seashell. |
Load the 3DPlot.vlx (or .LSP). If you want to just plot your own function, type or load its definion and call the (3DPlot) function with appropriate parameters. If successful, (3DPlot) returns the number of nodes created. Do not use too detailed (small) step values when testing surface shapes - the model complexity can grow quickly.
If you want to run the demo functions, start 3DPlot by typing the 3DPLOT command. Select the surface you want to generate by typing the respective number. Three progressbars ("Calculating", "Assembling", "Meshing") inform you about the process of surface generation.
Use the 3DPfaces command to toggle between the Mesh and 3DFaces generation.
 The 3DPLOT-generated object type is a mesh POLYLINE (AcDbPolyFaceMesh). You can explode it to individual 3DFaces.
Or you can smooth it (converting it to a SubD mesh - AcDbSubDMesh) with the MESHSMOOTH command and then smooth it more and more with repeated MESHSMOOTHMORE commands.
You can also use the 3DPthicken command to thicken the mesh to a solid for SAT export, for printing it on a 3D printer (STL, stereolithography), or making a cardboard model with Autodesk 123D Make or with the newer Autodesk Slicer for Fusion 360.
Or you can also use our 3DConstruct freeware utility to convert the generated surface to "thick wireframe" made of solids - see video.
See also Anaglyph for 3D stereographic presentation of 3D models.
The 3DPLOT-generated object type is a mesh POLYLINE (AcDbPolyFaceMesh). You can explode it to individual 3DFaces.
Or you can smooth it (converting it to a SubD mesh - AcDbSubDMesh) with the MESHSMOOTH command and then smooth it more and more with repeated MESHSMOOTHMORE commands.
You can also use the 3DPthicken command to thicken the mesh to a solid for SAT export, for printing it on a 3D printer (STL, stereolithography), or making a cardboard model with Autodesk 123D Make or with the newer Autodesk Slicer for Fusion 360.
Or you can also use our 3DConstruct freeware utility to convert the generated surface to "thick wireframe" made of solids - see video.
See also Anaglyph for 3D stereographic presentation of 3D models.
Here is the Enneper surface sample as a DWG and a STL model (142kB, scaled 10x) ready to print in 3D, or to import into 123D Make (see the picture), or to import into Inventor or Revit.
You can use the freeware utility Normals (see Download) to automatically color front/back-faces of the model, improving its presentation. Please note you have to explode the 3D mesh to individual 3Dfaces to use Face recolor in Normals. A sample of Breather2 model colored through Normals:
You can also use the AutoClass utility (see Download) to color-classify other properties of 3Dfaces, e.g. Z of the centroid - see example (the DWG):
If you want to use your own 3D functions in 3DPlot, you need to perform two operations: 1) define the function; 2) call the (3DPlot) function to draw it. E.g. if you want to draw a 3D surface defined by Z = sin (2 * x * y), use these two LISP "commands" (e.g. on the AutoCAD commandline):
(defun myFunc (x y) (list x y (sin (* 2 x y))))
(3DPlot myFunc -1.0 1.0 0.1 -1.0 1.0 0.1)
The first one defines a function "myFunc" (needs to return a list of X Y Z coordinates). The second calls the plot engine for points in the interval (-1;1) in both dimensions, in steps of 0.1.
Another example - a simple parametric sphere (here: 20 steps in each range; watch for the normals, backfaces):
(defun fXYsphere (u v) (list (* (cos u)(cos v)) (* (sin u)(cos v)) (sin v)))
(3Dplot fXYsphere 0 pi (/ pi 20) 0 (* 2 pi) (/ (* 2 pi) 20))
The Möbius strip in 3DPlot:
(defun fMoebius (u v) (list
 (* (+ 1 (* 0.5 v (cos (/ u 2.0)))) (cos u))
 (* (+ 1 (* 0.5 v (cos (/ u 2.0)))) (sin u))
 (* 0.5 v (sin (/ u 2.0)))
))
(3DPlot fMoebius 0 (* 2 pi) (/ pi 20) -1 1 0.2)
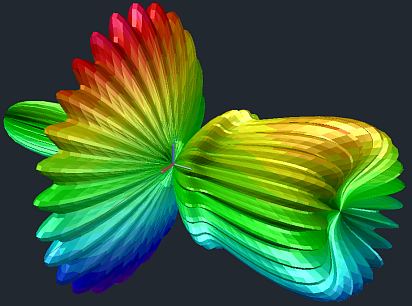
 And a much more complicated example of a Breather surface employing locally defined hyperbolic functions for its parametrization expressions:
(defun fXYBreather (u v / b r w denom)
 (defun sinh (x) (/ (1- (exp (* 2.0 x))) (* 2.0 (exp x))))
 (defun cosh (x) (/ (1+ (exp (* 2.0 x))) (* 2.0 (exp x))))
 (defun sqr (x) (* x x))
 (setq b 0.4  r (- 1.0 (sqr b))  w (sqrt r)); 0.4 = density
 (setq denom (* b (+ (sqr (* r (cosh (* b u)))) (sqr (* b (sin (* w v)))))))
 (list
  (+ (- u) (/ (* 2.0 r (cosh (* b u)) (sinh (* b u))) denom))
  (/ (* 2.0 w (cosh (* b u)) (- (- (* w (cos v) (cos (* w v)))) (* (sin v) (sin (* w v))))) denom)
  (/ (* 2.0 w (cosh (* b u)) (+ (- (* w (sin v) (cos (* w v)))) (* (cos v) (sin (* w v))))) denom)
))
(3Dplot fXYbreather -13.2 13.2 (/ 26.4 60) -37.4 37.4 (/ 74.8 150))
See more models created with 3DPLOT in the CAD block library on CADforum:
 3DPLOT parametric DWG models
NB:
3DPlot (VLX) is freeware. CAD Studio's customers can download full source version of 3Dplot (.LSP) from the Helpdesk server.
3DPlot is a free utility by CAD Studio, do not publish it online on other than CADstudio's web servers. Contact CAD Studio for feature enhancements.
 Download the 3DPlot application (for AutoCAD 2000-2018+)


